Ontario MLS® home sales remain subdued in June but show early signs of turnaround
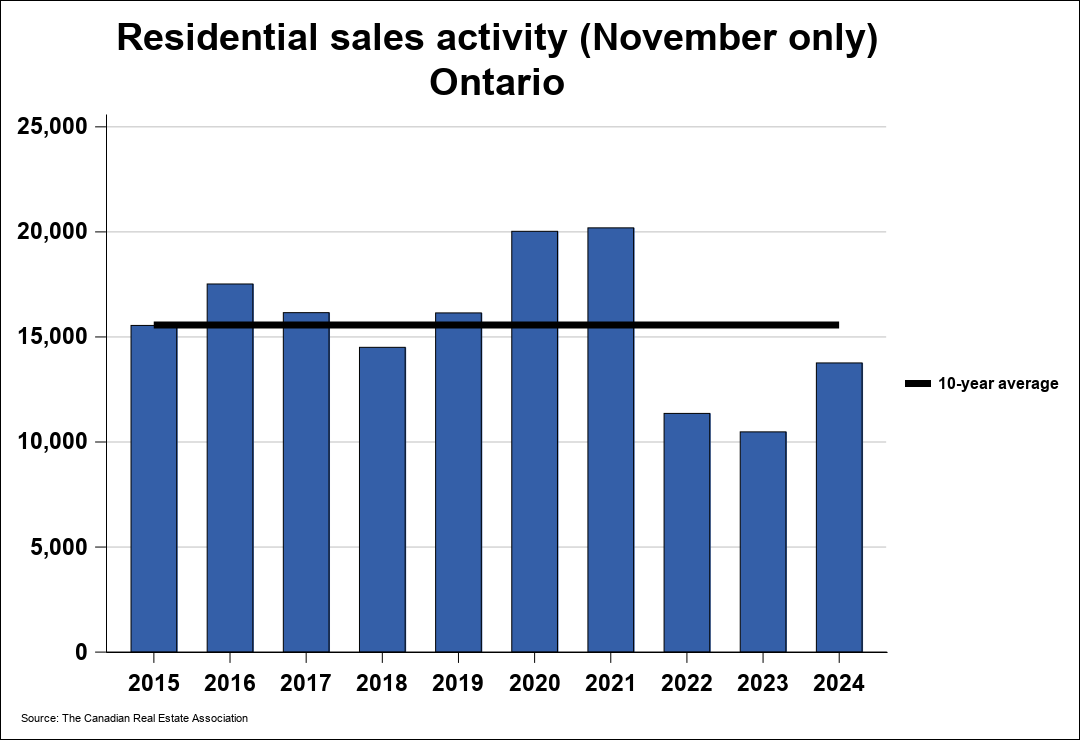

Residential sales activity reported through the MLS® Systems of real estate boards in Ontario numbered 16,961 units in June 2025. This increased by 1.1% from June 2024.
Home sales were 14% below the five-year average and 22.3% below the 10-year average for the month of June.
On a year-to-date basis, home sales totalled 80,156 units over the first six months of the year. This was a significant decrease of 13.4% from the same period in 2024.
Nationally, home sales activity was up modestly by 3.5% from year-ago levels in June 2025.
The average price of resale residential homes sold across the province in June 2025 was $852,036, down modestly by 3.9% from June 2024.
The more comprehensive year-to-date average price was $852,019, a minor decrease of 3.6% from the first six months of 2024.
The national average price, by comparison, marked a small reduction of 1.3% on a year-over-year basis to $691,643 in June 2025.
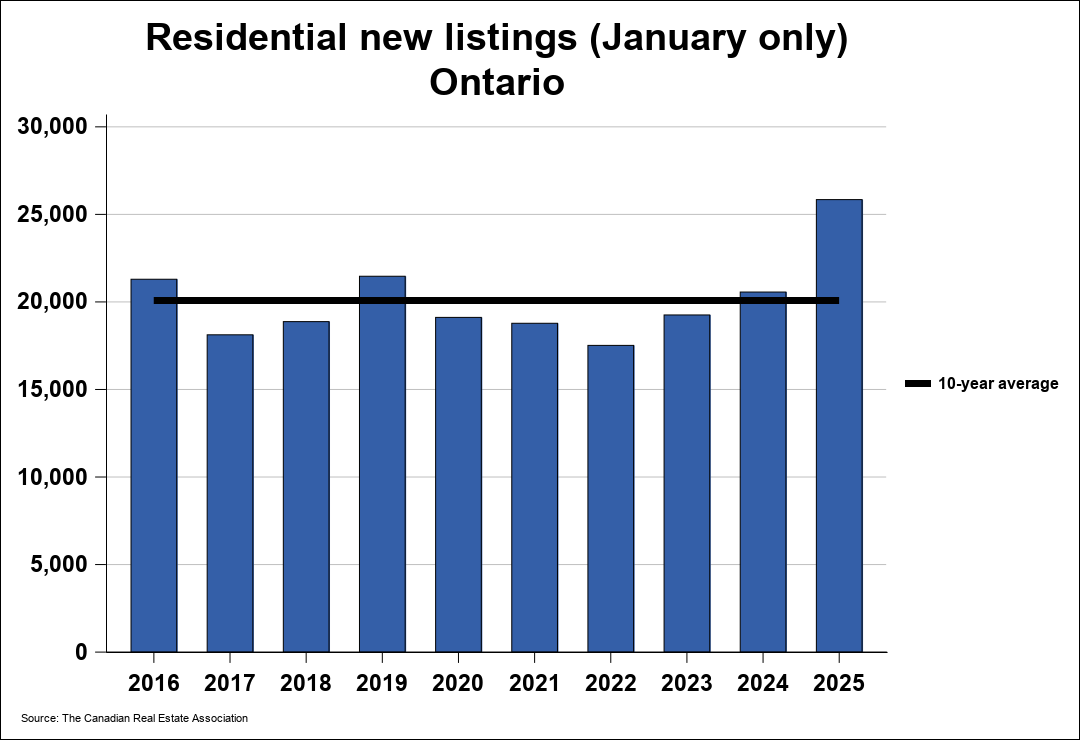
The number of new listings on MLS® Systems of real estate boards in Ontario increased by 8.5% from June 2024. There were 45,022 new residential listings in June 2025. This was also the largest number of new listings added in the month of June in history.
New listings were 8.3% above the five-year average and 12.4% above the 10-year average for the month of June.
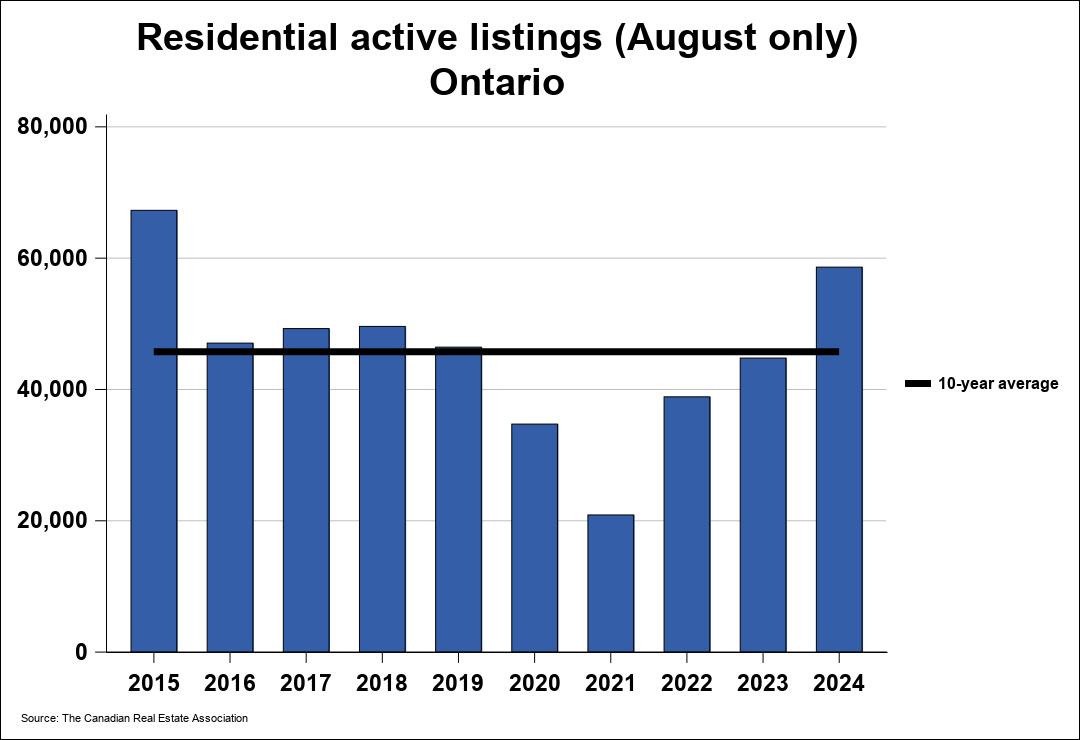
Active residential listings numbered 78,605 units on the market at the end of June, a gain of 18% from the end of June 2024. Active listings haven’t been this high in the month of June in more than a decade.
Active listings were 48.1% above the five-year average and 47.4% above the 10-year average for the month of June.
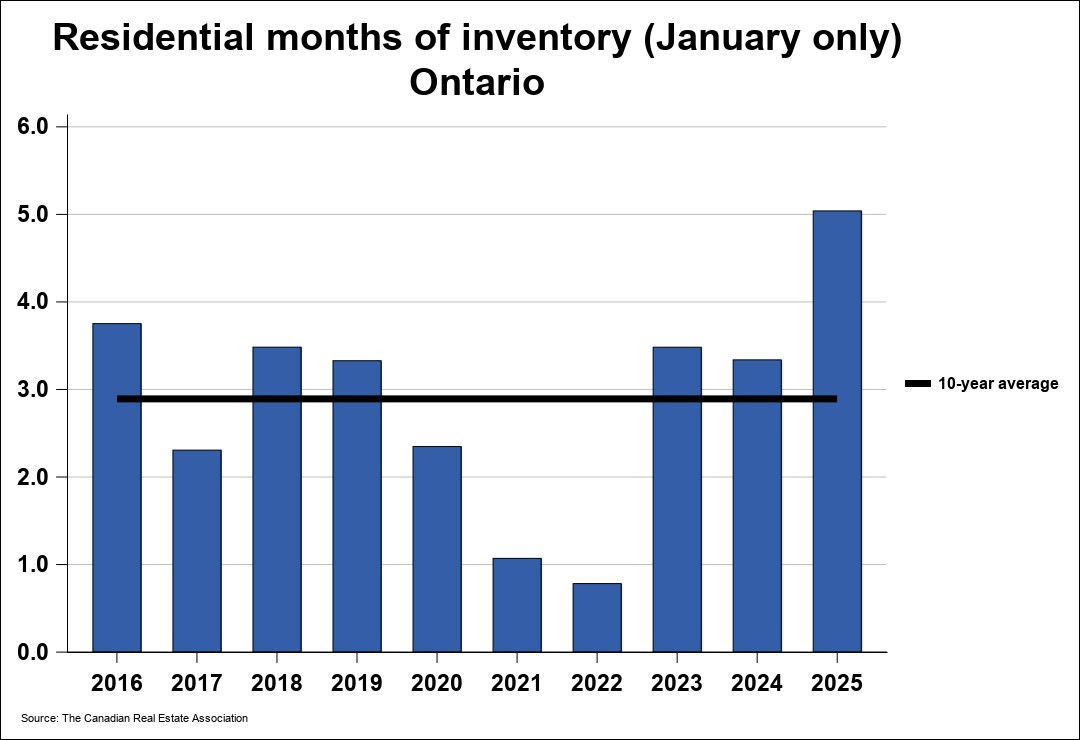
Months of inventory numbered 4.6 at the end of June 2025, up from the 4 months recorded at the end of June 2024 and above the long-run average of 2.6 months for this time of year. The number of months of inventory is the number of months it would take to sell current inventories at the current rate of sales activity.
The dollar value of all home sales in the province in June 2025 was $14.5 billion, was a small reduction of 2.8% from the same month in 2024.
| Ontario Monthly Summary | ||||
|---|---|---|---|---|
| June 2025 | Residential Sales | Year-over-year % change | Residential Average Price | Year-over-year % change |
| Central1 | 6,757 | -0.6 | $1,112,837 | -5.1 |
| Eastern2 | 2,591 | 8.9 | $667,391 | 3.5 |
| Northeastern3 | 1,716 | -8.0 | $769,280 | -3.1 |
| Northern4 | 1,067 | 21.2 | $424,190 | 0.6 |
| Southern5 | 2,628 | -3.2 | $793,293 | -1.4 |
| Western6 | 2,202 | 3.4 | $610,927 | -0.9 |
| Ontario | 16,961 | 1.1 | $852,036 | -3.9 |
| Ontario Year-To-Date Summary | ||||
|---|---|---|---|---|
| YTD 2025 | Residential Sales | Year-over-year % change | Residential Average Price | Year-over-year % change |
| Central1 | 33,391 | -16.9 | $1,107,418 | -3.4 |
| Eastern2 | 11,766 | 0.9 | $648,689 | 2.5 |
| Northeastern3 | 7,446 | -22.0 | $747,704 | -2.6 |
| Northern4 | 4,121 | 4.3 | $411,485 | 3.4 |
| Southern5 | 13,086 | -18.3 | $779,908 | -1.2 |
| Western6 | 10,346 | -7.4 | $600,732 | -0.8 |
| Ontario | 80,156 | -13.4 | $852,019 | -3.6 |
1 Oakville-Milton, Greater Toronto
2 Cornwall, Kingston and Area, Ottawa, Renfrew County, Rideau-St. Lawrence
3 Bancroft & District, Barrie & District, Kawartha Lakes, Lakelands, Northumberland Hills, Peterborough and the Kawarthas, Quinte & District
4 North Bay, Saul Ste. Marie, Sudbury, Thunder Bay, Timmins, Cochrane & Timiskaming Districts
5 Brantford Region, Guelph & District, Hamilton-Burlington, Kitchener-Waterloo, Niagara Region, Simcoe, and Cambridge
6 Chatham-Kent, Grey Bruce Owen Sound, Huron Perth, London & St. Thomas, Sarnia-Lambton, Windsor-Essex, Woodstock-Ingersoll-Tillsonburg
BOARD & ASSOCIATION INFORMATION
The Ontario Real Estate Association represents nearly 100,000 brokers and salespeople who are members of the 29 real estate boards throughout the province. OREA serves its REALTOR® members through a wide variety of support services, educational programs, advocacy, standard forms, and other offerings.
For additional information, please email info@orea.com
For more information, please contact:
Jean-Adrien Delicano
Media Relations Manager
T: 416-445-9910 x246
JeanAdrienD@orea.com

Cathy Polan


