Hints of Active Spring Market in March Housing Data
Monthly Housing Market Report
Ottawa, ON April 12, 2024 – While there are expectations the Canadian housing market will pick up on some level this year, home sales and prices were mostly unchanged on a month-over-month basis in March 2024, according to the latest data from the Canadian Real Estate Association (CREA).
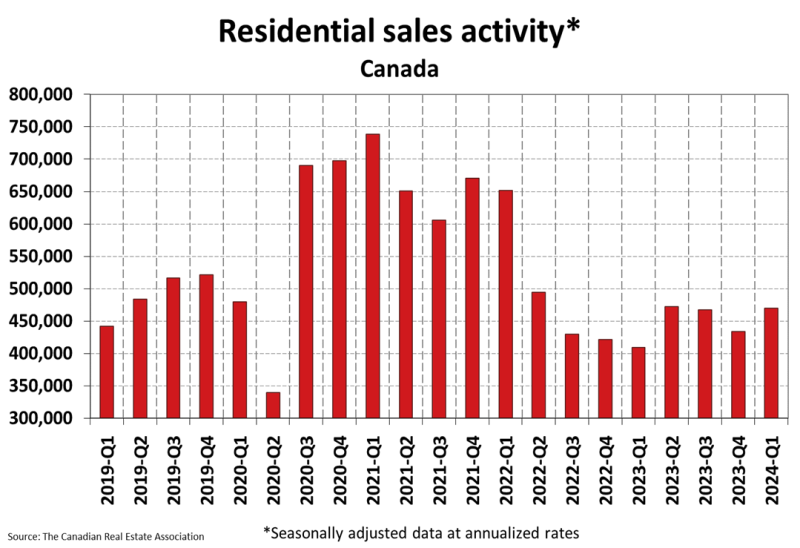
Home sales activity recorded over Canadian MLS® Systems edged up 0.5% between February and March 2024, holding around 10% below an average of the last 10 years. (Chart A)
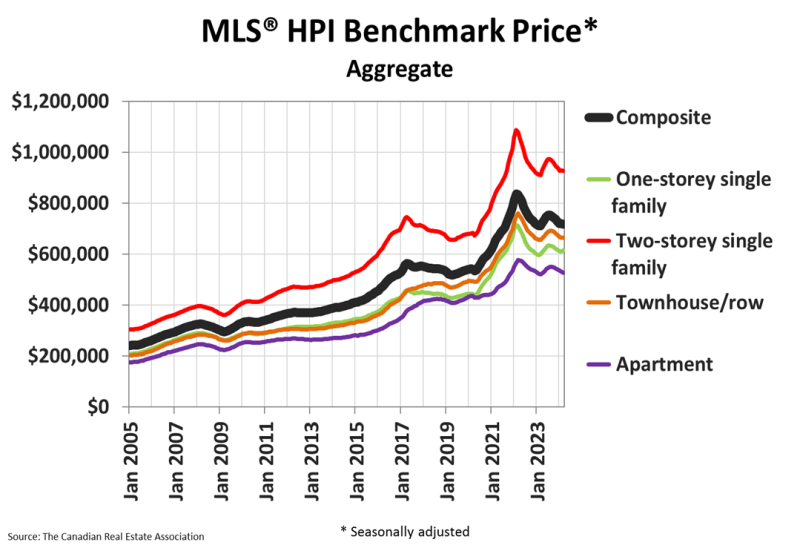
Likewise, the National Composite MLS® Home Price Index (HPI) was mostly unchanged on a month-over-month basis in March 2024, dipping 0.3%. (Chart B)
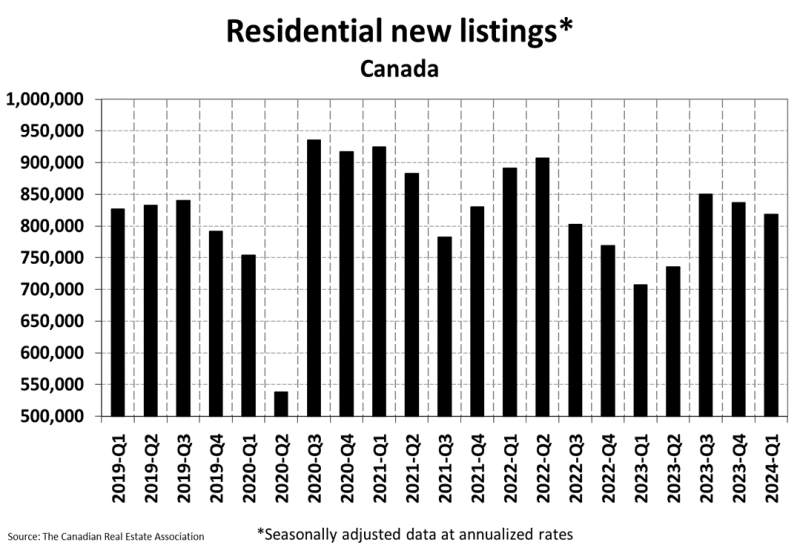
That said, weekly tracking showed a bounce in new supply around the second week of March, which lead to a burst of sales in the last week of the month, and a jump in listings in the first week of April.
“We’ll have to wait for the April data to really understand how buyers are responding to all these new properties for sale, but if you look at last spring as a guide and add to that record population growth in the last year and a central bank that is far more likely to cut this summer than raise like it did last year, it could get interesting,” said Shaun Cathcart, CREA’s Senior Economist. “Will the story be high interest rates keeping a lot of people on the sidelines this year, or the much expected and anticipated first rate cuts enticing a lot of people back into the market? Probably a bit of both.”
Highlights:
National home sales edged up 0.5% month-over-month in March.
Actual (not seasonally adjusted) monthly activity came in 1.7% above March 2023.
The number of newly listed properties declined 1.6% month-over-month.
The MLS® Home Price Index (HPI) dipped 0.3% month-over-month but was up 0.7% year-over-year.
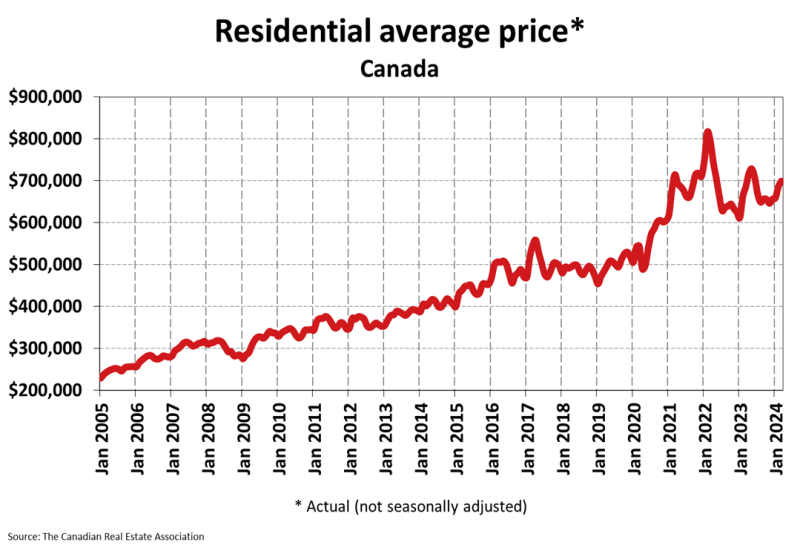
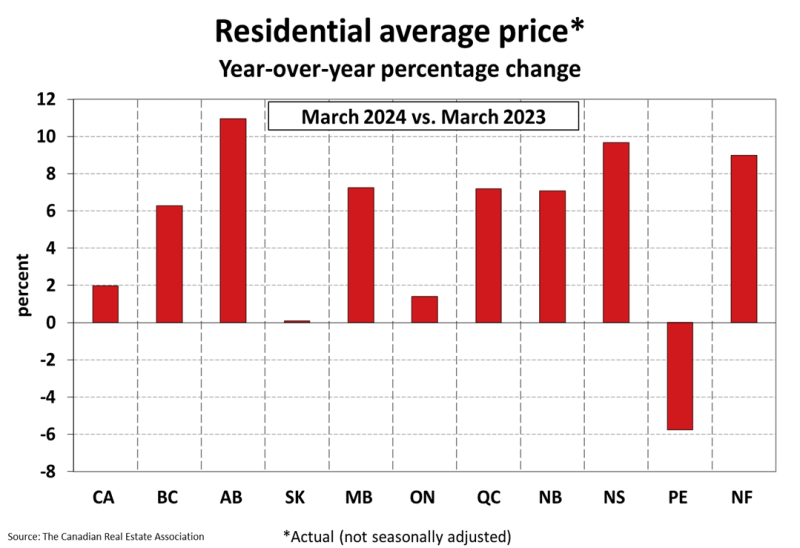
The actual (not seasonally adjusted) national average sale price posted a 2% year-over-year increase in March.
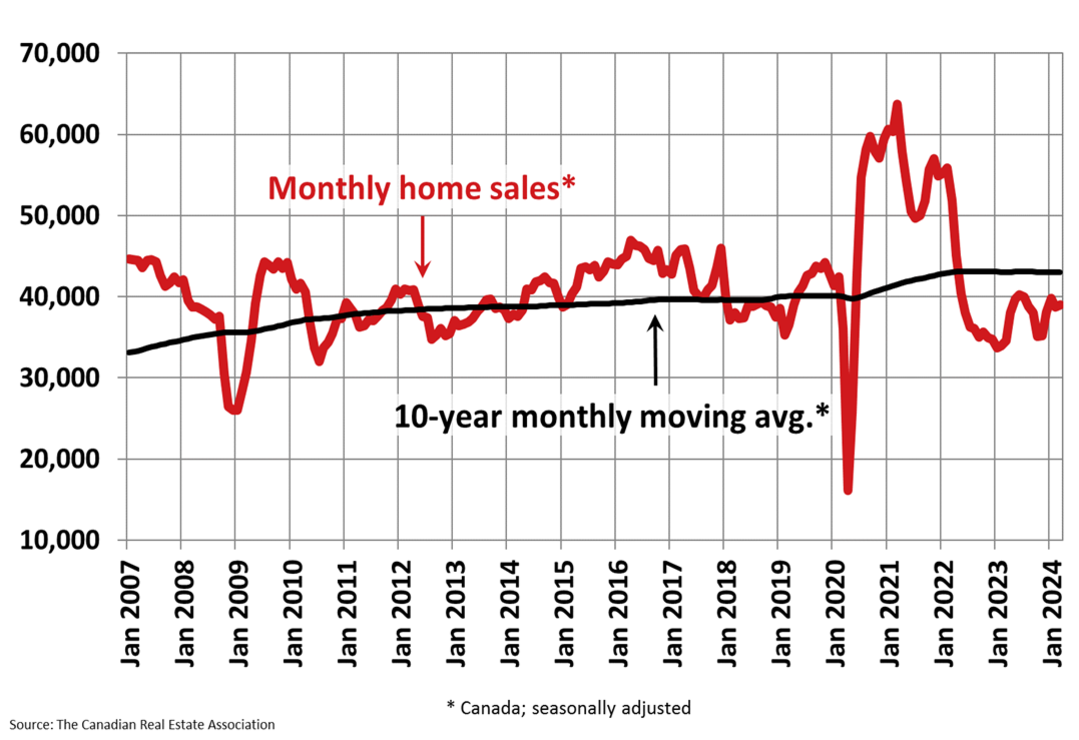
Chart A
The actual (not seasonally adjusted) number of transactions came in 1.7% above March 2023. That was a much smaller gain than those recorded in the previous two months, although a part of that does reflect a mostly inactive market during the Easter long weekend.
The number of newly listed homes declined by 1.6% on a month-over-month basis in March.
“While the official March monthly numbers were quite flat, anecdotal evidence from late last month and early April suggests activity is ramping up,” said Larry Cerqua, Chair of CREA. “If you’re looking to be part of the market story this spring, contact a REALTOR® in your area today,” continued Cerqua.
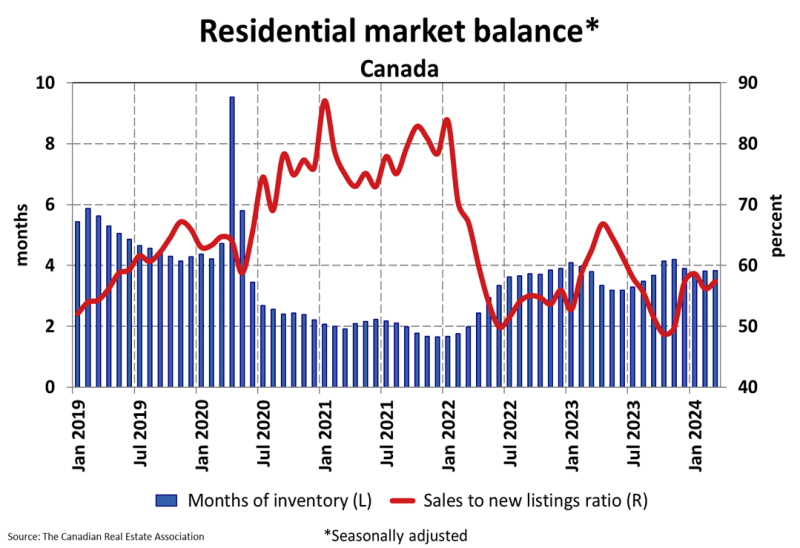
With sales edging up and new listings falling in March, the national sales-to-new listings ratio tightened to 57.4%. The long-term average for the national sales-to-new listings ratio is 55%. A sales-to-new listings ratio between 45% and 65% is generally consistent with balanced housing market conditions, with readings above and below this range indicating sellers’ and buyers’ markets respectively.
There were 3.8 months of inventory on a national basis at the end of March 2024, unchanged from the end of February. The long-term average is about five months of inventory.
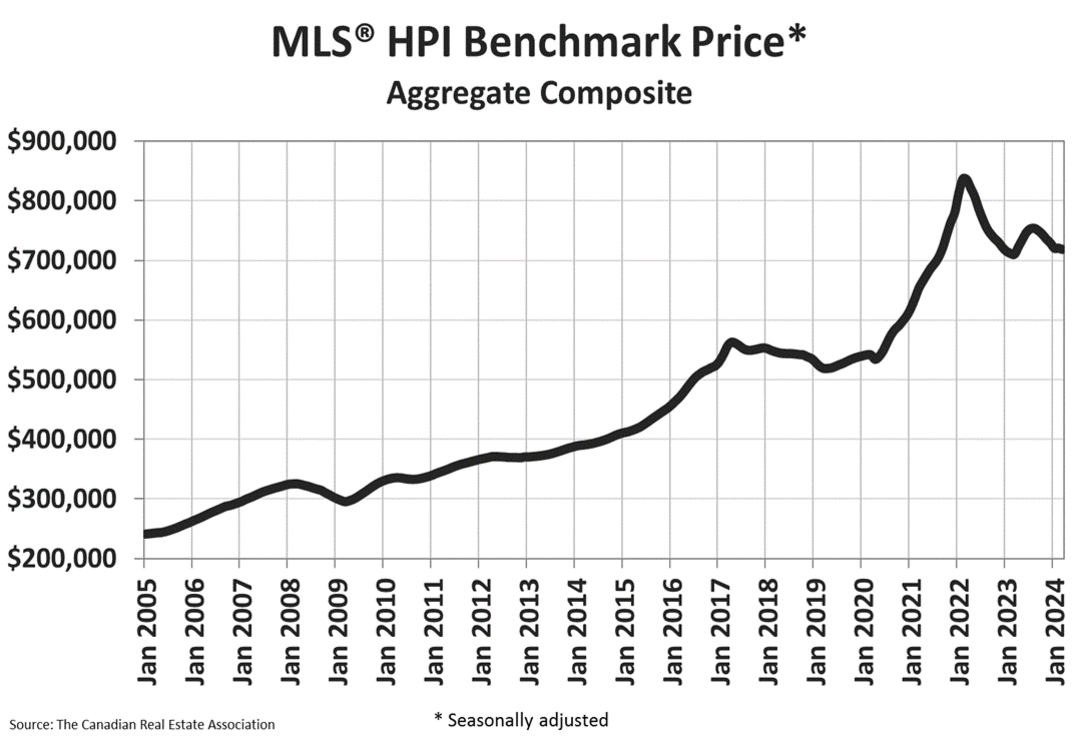
Chart B
The actual (not seasonally adjusted) national average home price was $698,530 in March 2024, up 2% from March 2023.
The next CREA statistics package will be published on Wednesday, May 15, 2024.
