Canadian Home Sales Mark Four-Year High for the Month of September
Monthly Housing Market Report
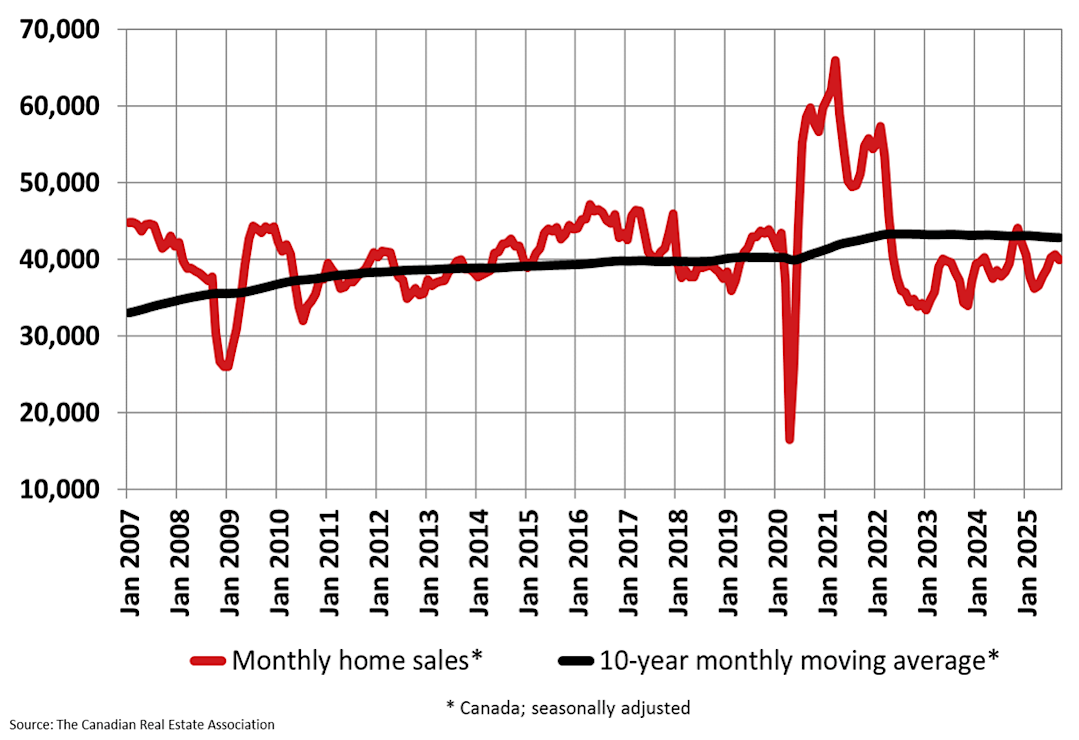
Ottawa, ON October 16, 2025 – The number of home sales recorded over Canadian MLS® Systems declined by 1.7% on a month-over-month basis in September 2025, ending a string of gains that began in April. That said, it was still the best month of September for sales since 2021. (Chart A)
The small monthly decline was the result of lower sales activity in Greater Vancouver, Calgary, Edmonton, Ottawa, and Montreal, which more than offset gains in the Greater Toronto Area and Winnipeg.
“While the trend of rising sales that began earlier this year took a breather in September, activity was still running at the highest level for that month since 2021, and that was true in July and August as well, said Shaun Cathcart, CREA’s Senior Economist. “With three years of pent-up demand still out there and more normal interest rates finally here, the forecast continues to be for further upward momentum in home sales over the final quarter of the year and into 2026.”
September Highlights:
National home sales declined 1.7% month-over-month.
Actual (not seasonally adjusted) monthly activity came in 5.2% above September 2024.
The number of newly listed properties edged down 0.8% on a month-over-month basis.
The MLS® Home Price Index (HPI) was little changed (-0.1%) month-over-month and was down 3.4% on a year-over-year basis.
The actual (not seasonally adjusted) national average sale price ticked up 0.7% on a year-over-year basis.

Chart A
New supply dropped 0.8% month-over-month in September. Combined with a slightly larger decline in sales activity, the sales-to-new listings ratio eased slightly to 50.7% compared to 51.2% in August. The long-term average for the national sales-to-new listings ratio is 54.9%, with readings roughly between 45% and 65% generally consistent with balanced housing market conditions.
There were 199,772 properties listed for sale on all Canadian MLS® Systems at the end of September 2025, up 7.5% from a year earlier but very close to the long-term average for that time of the year.
“While there are more buyers in the market now than at almost any other point in the last four years, sales activity is still below average and well below where the long-term trend suggests it should be,” said Valérie Paquin, CREA Chair. “As such, we expect things will continue to steadily pick up going forward. If you want to better understand how to buy or sell a property in this evolving market, contact a REALTOR® in your area today.”
There were 4.4 months of inventory on a national basis at the end of September 2025, unchanged from July and August and the lowest level since January. The long-term average for this measure of market balance is five months of inventory. Based on one standard deviation above and below that long-term average, a seller’s market would be below 3.6 months and a buyer’s market would be above 6.4 months.
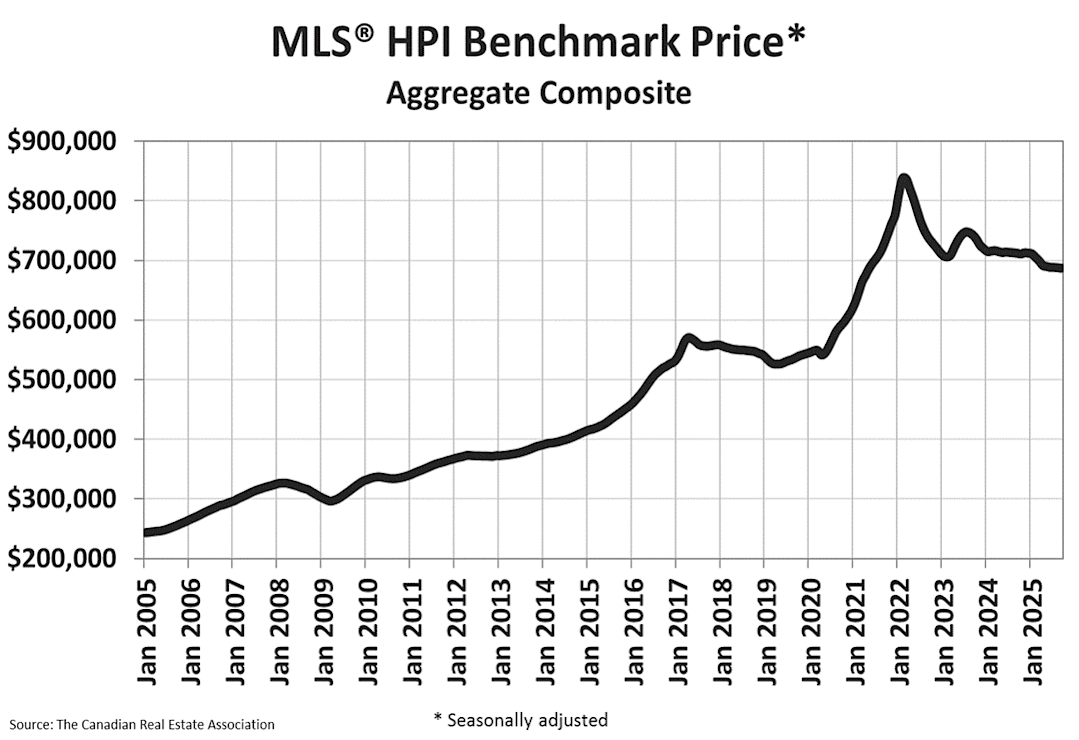
The National Composite MLS® Home Price Index (HPI) was again almost unchanged (-0.1%) between August and September 2025. Following declines in the first quarter of the year, the national benchmark price has remained mostly stable since April.
The non-seasonally adjusted National Composite MLS® HPI was down 3.4% compared to September 2024. Based on the extent to which prices fell off beginning in the fall of 2024, look for year-over-year declines to shrink in the fourth quarter of the year. (Chart B)

Chart B
The non-seasonally adjusted national average home price was $676,154 in September 2025, up 0.7% from September 2024.
The next CREA statistics package will be published on Monday, November 17, 2025.


