Home Sales in Canada End 2025 Quietly
Monthly Housing Market Report
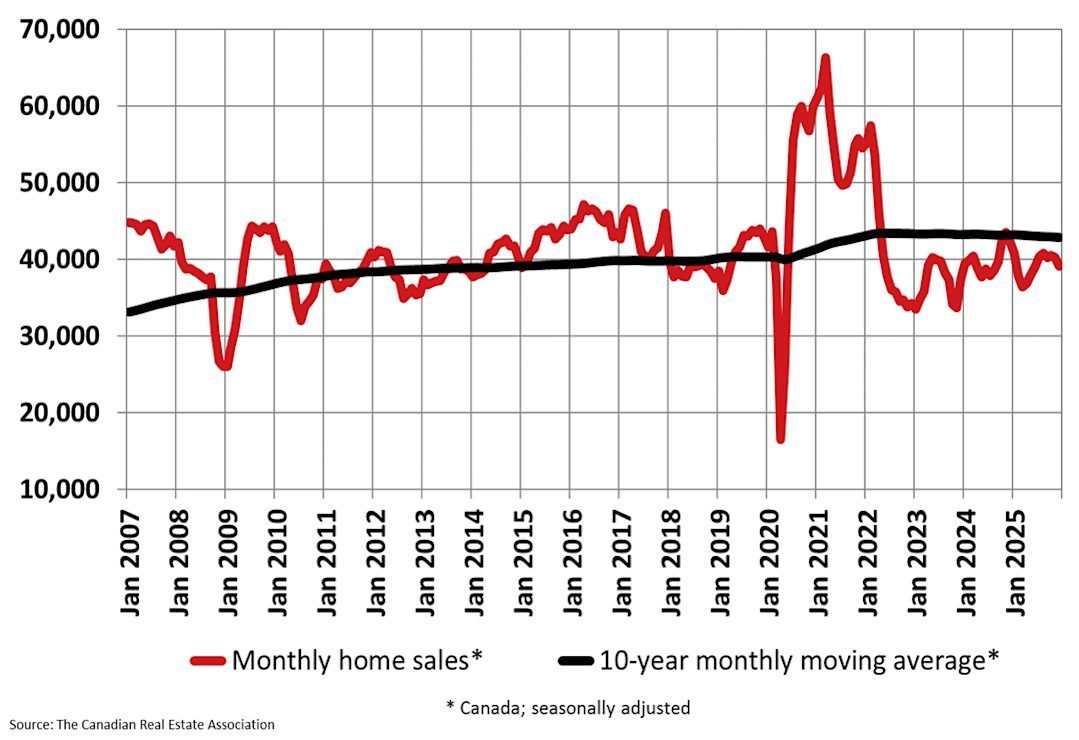
Ottawa, ON January 15, 2026 – The number of home sales recorded over Canadian MLS® Systems declined 2.7% on a month -over-month basis in December 2025. (Chart A)
On an annual basis, transactions totalled 470,314 units in 2025, a decrease of 1.9% from 2024. The year was characterized by a tariff -induced flight of buyers back to the sidelines in the first quarter, followed by a decent sales rally mid -year, and a bit of a stall to finish off 2025.
“There doesn’t appear to have been much rhyme or reason to the month - over-month decline in home sales in December, which was simply the result of coincident but seemingly unrelated slowdowns in Vancouver, Calgary, Edmonton, and Montreal,” said Shaun Cathcart, CREA’s Senior Economist. “For that reason, it would be prudent for market observers to resist the temptation to trace a line from the end of 2025 into 2026. Rather, we continue to expect sales to move higher again as we get closer to the spring, rejoining the upward trend that was observed throughout the spring, summer, and early fall of last year.”
December Highlights:
National home sales declined 2.7% month -over-month.
Actual (not seasonally adjusted) monthly activity came in 4.5% below December 2024.
The number of newly listed properties dropped 2% on a month -over-month basis .
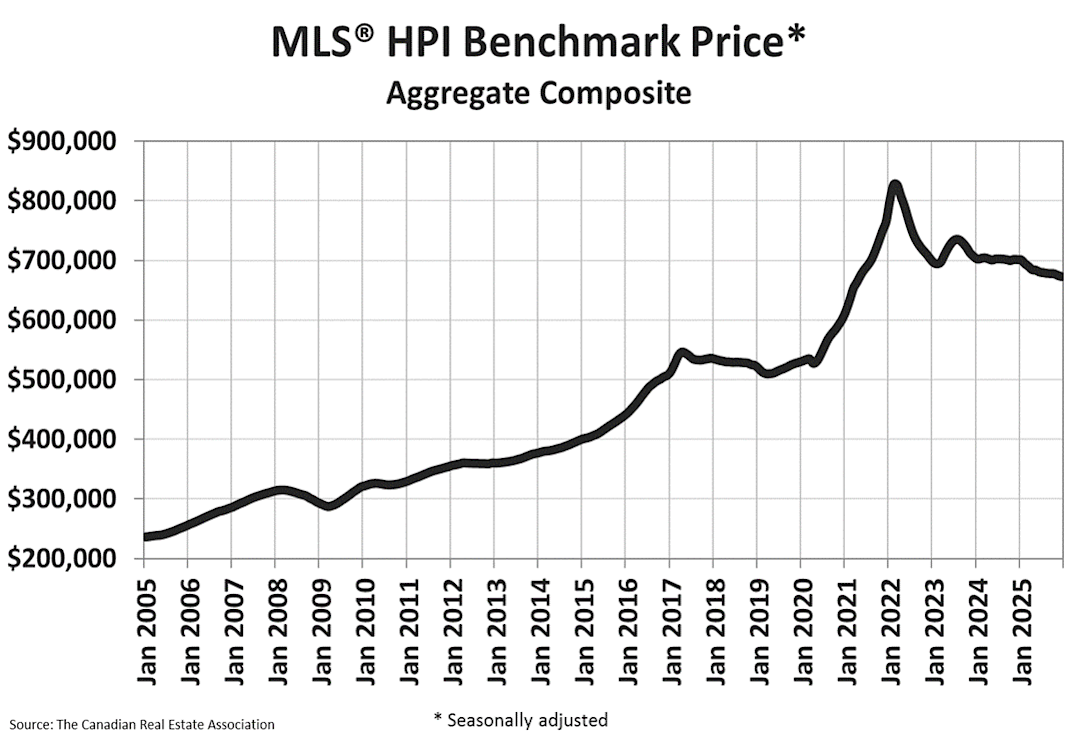
The MLS® Home Price Index (HPI) dipped 0.3% month-over-month and was down 4% on a year-over-year basis.
The actual (not seasonally adjusted) national average sale price was virtually unchanged ( -0.1%) on a year-over-year basis.

Chart A
New supply declined by 2% on a month -over-month basis in December, marking a fourth straight monthly drop. Combined with a slightly larger decrease in sales activity in December, the sales -to-new listings ratio eased to 52.3% compared to 52.7% in November. This remains close to the long-term average national sales-to-new listings ratio of 54.9%. Readings roughly between 45% and 65% are generally consistent with balanced housing market conditions.
There were 133,495 properties listed for sale on all Canadian MLS® Systems at the end of December 2025, up 7.4% from a year earlier but 9.9% below the long -term average for that time of year. Inventories have been falling since May 2025 owing to the mid -year rally in demand, meaning active listings could be back posting year-over-year declines around the time this year’s spring market gets going.
“While we remain in the quiet time of year for a little while longer, the spring market is now just around the corner, and it is expected to benefit from four years of pent -up demand, and interest rates that at this point are about as good as they are going to get,” said Valérie Paquin, CREA Chair. “Barring any further major uncertainty -causing events, that means we should see a more active market this year. You can get a jump on your 2026 housing plans by contacting a local REALTOR ®.”
There were 4.5 months of inventory on a national basis at the end of December 2025, up slightly from 4.4 months where the measure had been since August. The long -term average for this measure of market balance is five months of inventory. Based on the measure of one standard deviation above and below that long -term average, a seller’s market would be below 3.6 months, and a buyer’s market would be above 6.4 months.
The National Composite MLS ® Home Price Index (HPI) fell by 0.3% between November and December 2025. It was similar to the dip recorded in November and could reflect some sellers making price concessions in order to sell properties before the end of the year. Most overall price softening in December came from markets in Ontario’s Greater Golden Horseshoe region.
The non-seasonally adjusted National Composite MLS ® HPI was down 4% compared to December 2024. (Chart B)
Under the surface, year -over-year declines are larger for condo apartments and townhomes, and smaller for one - and two-storey detached homes.

Chart B
The non-seasonally adjusted national average home price was $673,335 in December 2025, virtually unchanged (-0.1%) from December 2024.
The next CREA statistics package will be published on Wednesday, February 18 , 2026.


