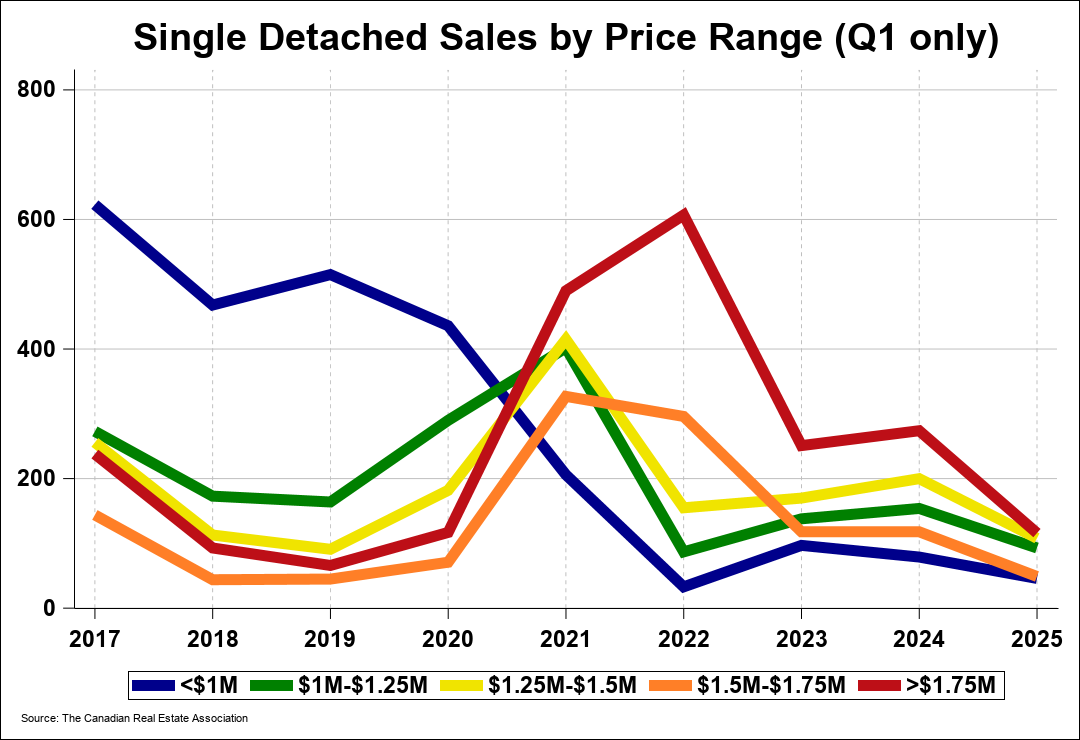
Single Detached
The market for single detached homes was tightest in the range $1M-$1.25M, where demand was strongest relative to supply.
Single detached homes in the price range below $1M spent the least amount of time on market prior to selling in the first quarter of 2026.
| Summary – Sales by Price Range Year-over-year percentage change | |||||
|---|---|---|---|---|---|
| Single Detached | <$1M | $1M-$1.25M | $1.25M-$1.5M | $1.5M-$1.75M | >$1.75M |
| Q1-2026 | 60 | 14 | -12.7 | 26 | -25.2 |
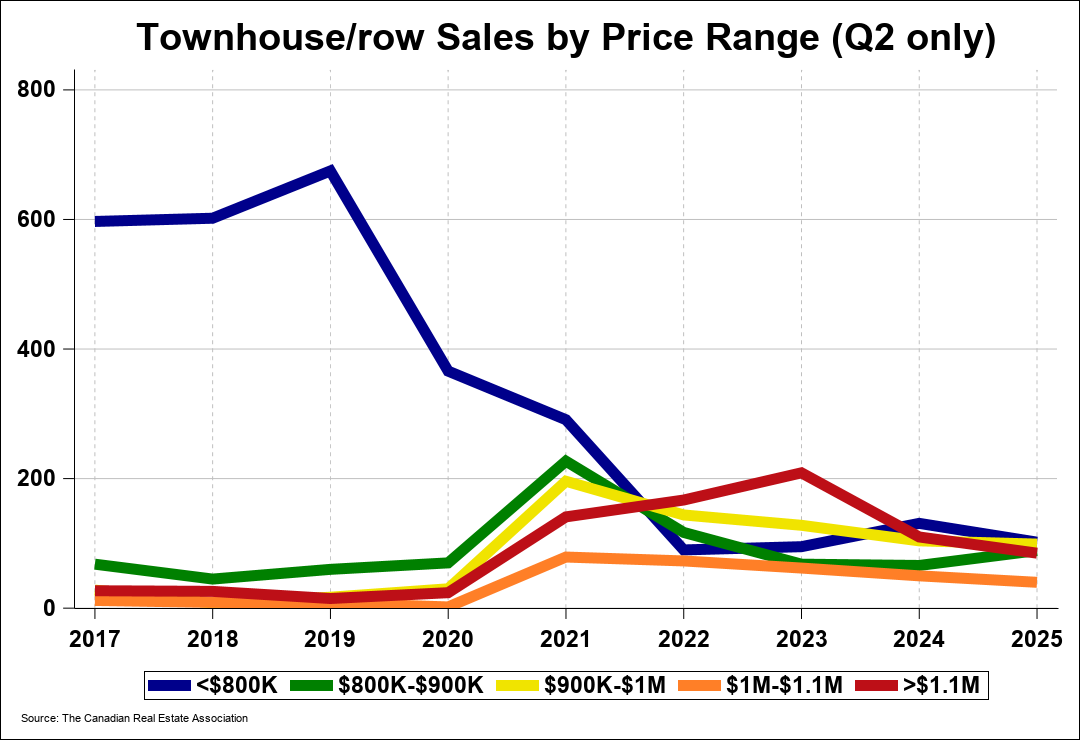
Townhouse
The market for townhouse units was tightest in the ranges $1M-$1.1M, where demand was strongest relative to supply.
Townhouse units in the price range $800K-$900K spent the least amount of time on market prior to selling in the first quarter of 2026.
| Summary – Sales by Price Range Year-over-year percentage change | |||||
|---|---|---|---|---|---|
| Townhouse/Row | <$800K | $800K-$900K | $900K-$1M | $1M-$1.1M | >$1.1M |
| Q1-2026 | 35.2 | 8.9 | -36.2 | -21.1 | -50.8 |
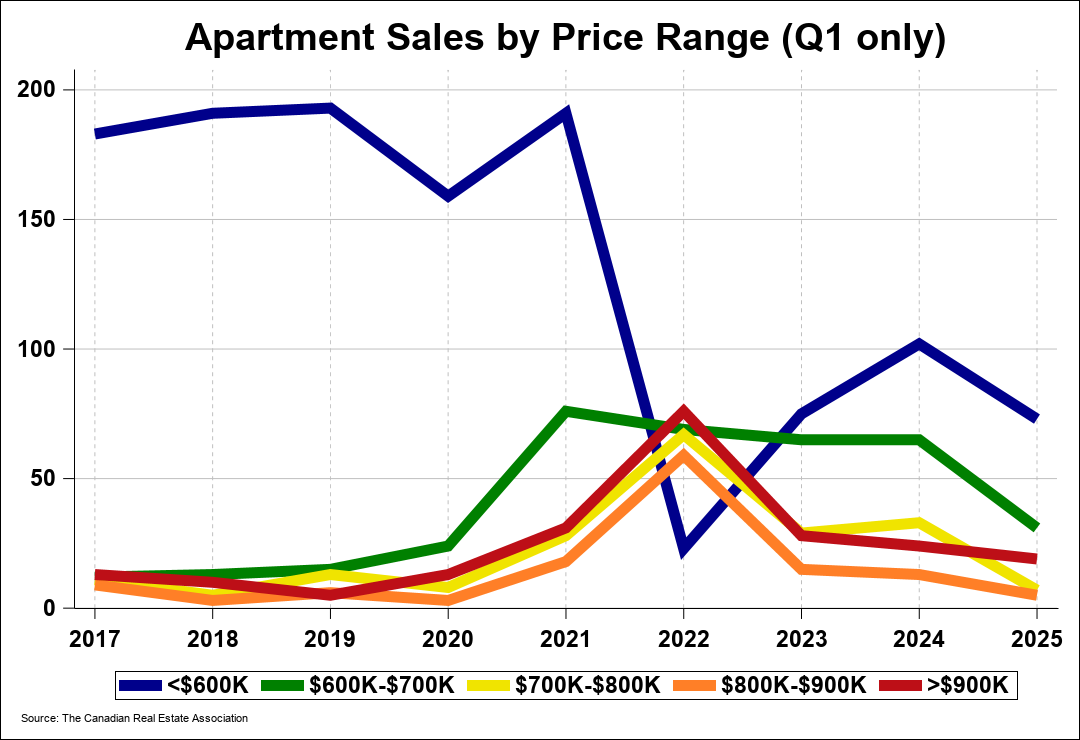
Apartment
The market for apartment units was tightest in the range below $600K, where demand was strongest relative to supply.
Apartment units in the price range $700K-$800K spent the least amount of time on market prior to selling in the first quarter of 2026.
| Summary – Sales by Price Range Year-over-year percentage change | |||||
|---|---|---|---|---|---|
| Apartment | <$600K | $600K-$700K | $700K-$800K | $800K-$900K | >$900K |
| Q1-2026 | 26.4 | -68.8 | -57.1 | -40 | -33.3 |


